
The lingering question: Would state-of-the-art sailing techniques apply to historic tall ships? The chance for an answer came from a dear friend, Rear Admiral of the Argentine Navy Cesar Recalde, a true yachtsman and expert EVOLUTION user.
“What if we tested EVOLUTION on the Libertad Frigate, our navy’s training ship?” said César. “They start their instructional journey in a week. It would be best if you spoke to the commanding officer as soon as possible,” he added casually.
So, I did. I was allowed to pick any of the planned legs. My choice was Fortaleza, Brazil, to Veracruz, Mexico. The trade winds would simplify instrument calibration, polar curves development, and testing.
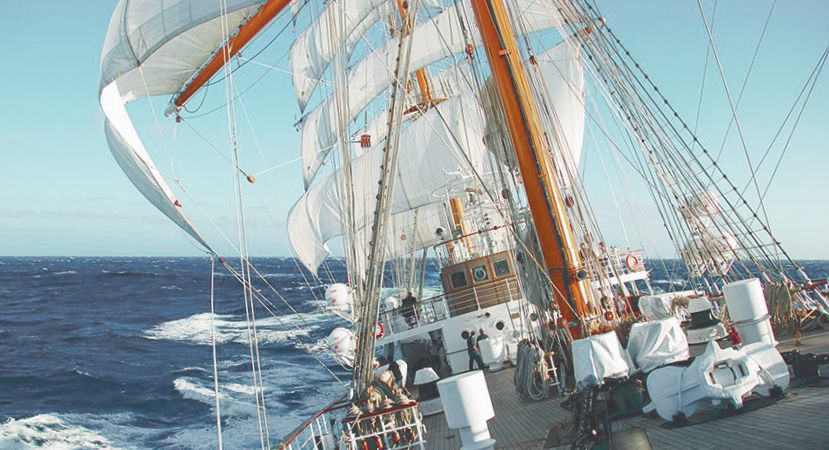
At this point, I should mention that the “ARA Libertad” is a 100+ m, three-masted tall ship, mainly used to train Argentina’s navy cadets. She has excellent performance as a tall ship, winning the Boston Teapot Trophy nine times in total: in 1966, 1976, 1981, 1985, 1987, 1992, 1998, 2000, and 2007. For more information on this ship, please look at this link.
Back to my story, I left Fortaleza aboard the Libertad three weeks later. Yes, a sailing yacht like any other, but immersed in a military environment. It took me some time to adapt!
After the equatorial crossing rituals and a few hassles, EVOLUTION was running. Connecting the ship’s instruments to the system was easy. To my surprise, they were military-grade, precise, and incredibly well-calibrated.
Polar Curves
The next challenge was creating the polar curves describing the ship’s performance at different true wind angles and speeds. Before coming aboard, I already had done my homework, coming up with an estimated data set for this ship.
Then, thanks to the patient officers at the bridge, it was possible to steer the ship into different wind angles. The coming days brought a good range of wind speeds. After processing some numbers, I had my polar curves.
With the system configured for the Libertad, the next step was to see if EVOLUTION could predict how the ship performed in the real world. So, together with the chief navigator, three tests were proposed.
Testing
First, would the ship’s speed match what EVOLUTION provided as a target for a given wind speed and angle? As we were sailing downwind, the system should also give the optimum wind angle for the best velocity made good downwind (VMG).
Second, could EVOLUTION predict a time to a lay-line (gybe point)? A few hours in advance, the system should show where the gybe point would be and when we would be there.
And third, could the system provide information on the best way to trim the sails? In other words, does this type of ship responds to slight sail trimming?
To answer these questions, we will use the replay from log function, which reproduces the information recorded by the system.
We focused on a stretch of a few hours of navigation for these first tests. We were sailing a broad reach in the Caribbean Sea with winds oscillating between 18 and 25 knots.
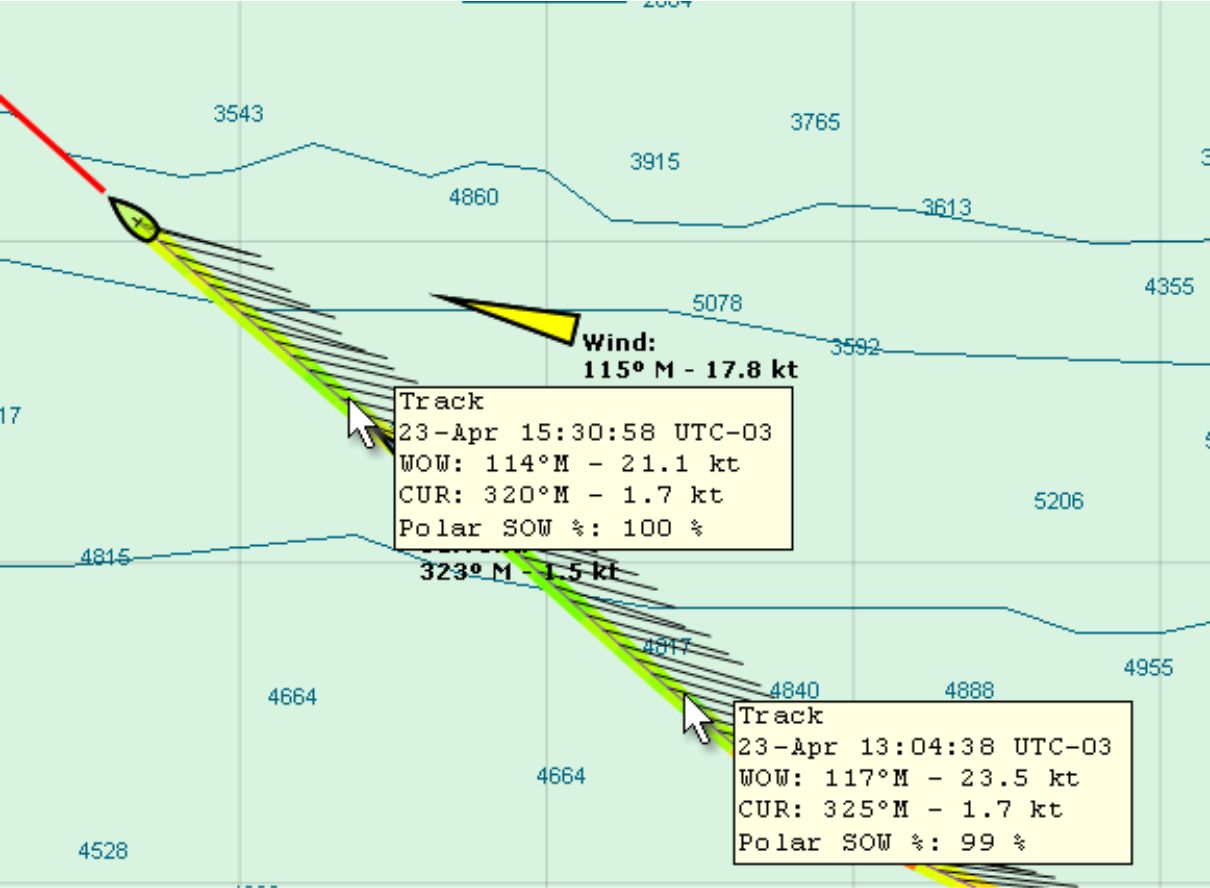
The first test was quite simple; as you can see in the image, the green wake left by the ship indicates that her actual speed was perfectly compatible with what the polar curves predicted.
Placing the cursor at two points on the wake, we can see a box showing the conditions at those times. The legends WOW indicates the wind, CUR the current, and Polar SOW% displays the relationship between the actual speed of the boat and that extracted from the polar curves for the angle and speed of the wind at that moment. The Polar SOW% shows 99% and 100% in the two points analyzed. The first test passed with flying colors!
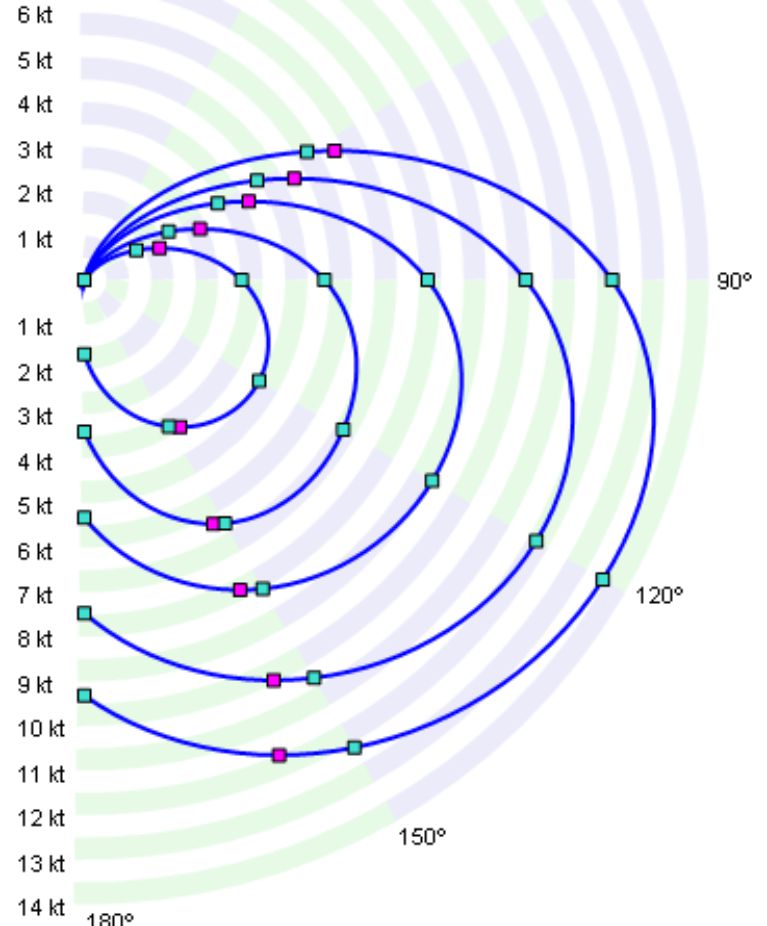
Before moving on to the second test, it is worth clarifying that most sailing boats do not sail well dead downwind, especially a tall ship. It is usually more effective to sail with a slight angle from direct downwind, something between a run and a broad reach. It is easy to see this on the polar curves graph.
Consequently, if our destiny is directly downwind, we will have to tack downwind gybing now and then.
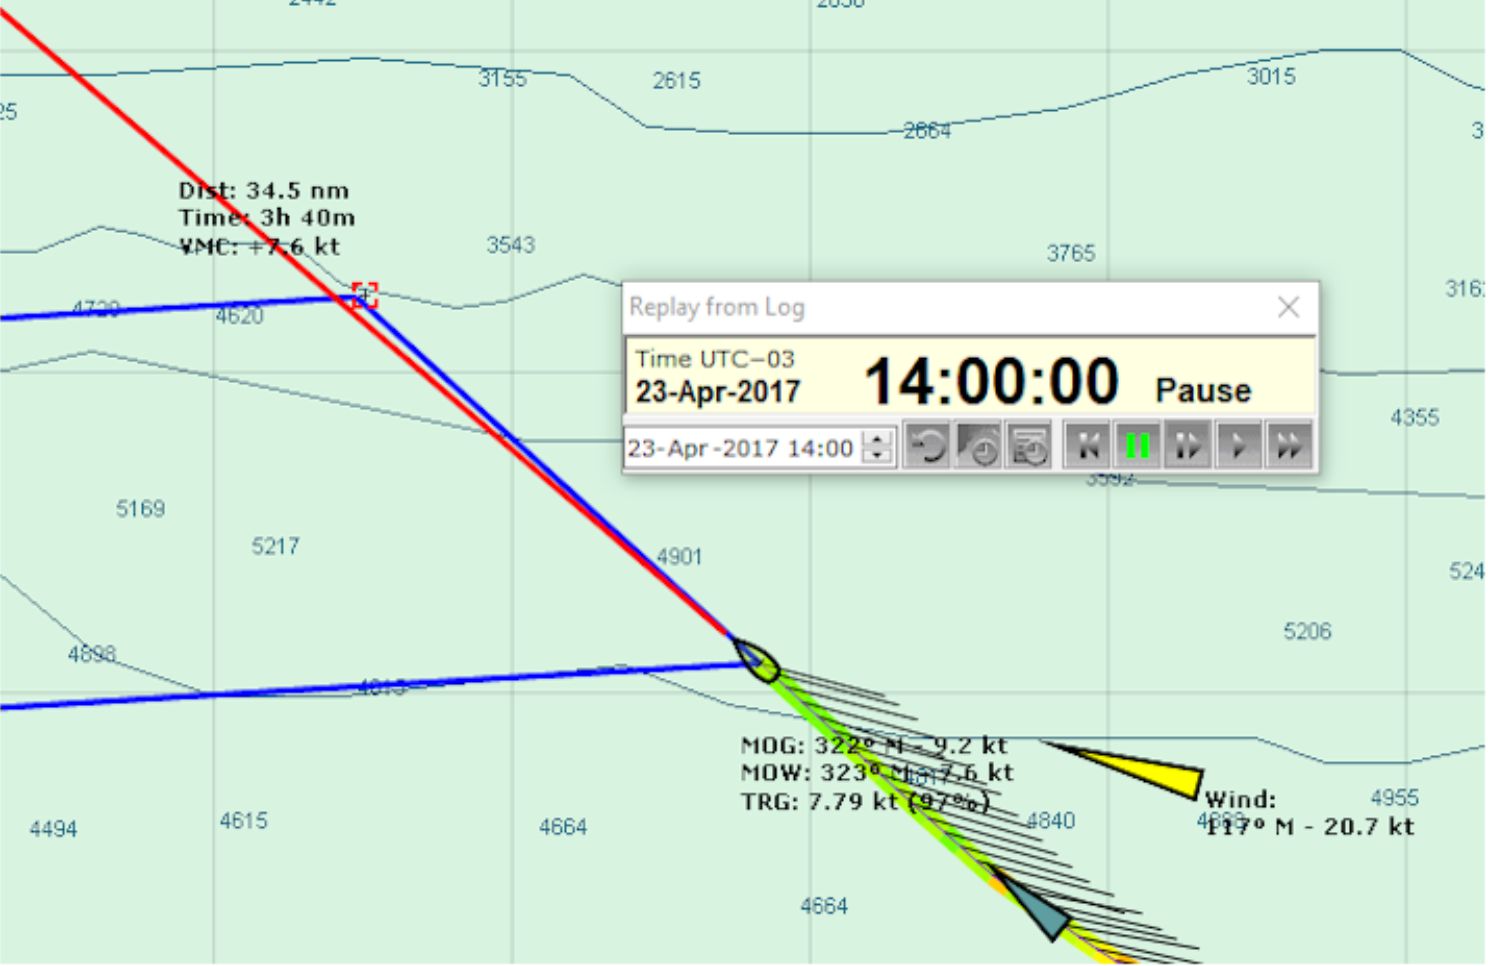
This was our case during the second test. In addition to providing the optimal TWA, EVOLUTION constantly predicted how long it would take to reach the gybe point.
At 14:00, the system indicated that it would take 3 hours and 40 minutes. A few minutes before 17:40, we had arrived at this point and executed a clean gybe to port.

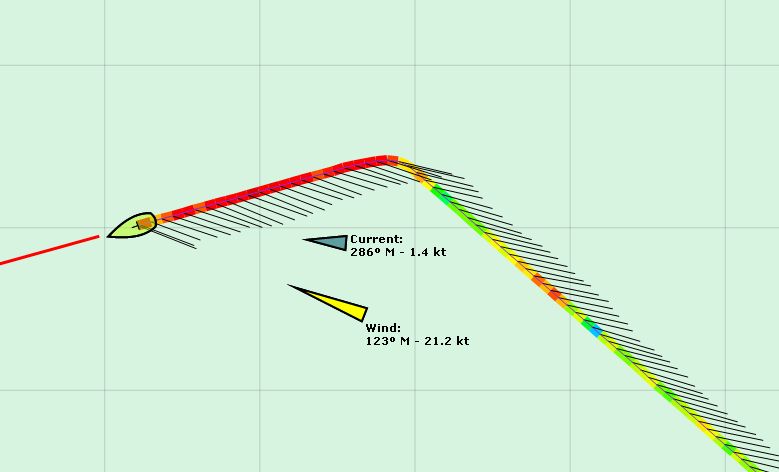
On the leg on starboard, where the ship showed an ideal performance, the yards were set perpendicular to the boat’s centerline. The sails received the wind with an angle of attack of approximately 75 degrees.
For the third test, it was decided that, after gybing, the same angle between the boat and the wind would be maintained (same TWA from the opposite side), but the yards would be adjusted so that the sails receive the wind at an angle of attack of 90 degrees.
Much to everyone’s surprise, after gybing, the boat’s average performance dropped from 100% to 80%! In the screenshot below, this is shown by the wake going from green to red.
This was expected; sailing dead downwind and perpendicular wind on sails is not the most efficient way to cruise.
Conclusions
Returning to our original question, “Would state-of-the-art sailing techniques apply to historic tall ships?” the answer is a definitive YES.
This experience proved that the performance of square-rigged tall ships could be expressed perfectly by elaborating their polar curves, which is always the starting point of the correct implementation of EVOLUTION.
In the 30 days at sea and the use of EVOLUTION, I had the opportunity to discuss other exciting topics such as numerical forecasts and determining the optimal route.
Without a doubt, this was a great learning experience.