Polar curves are part of today’s sailing world. They are commonplace in sailboat design, rating methods, and instrument systems. They are also at the core of software applications, such as EVOLUTION.
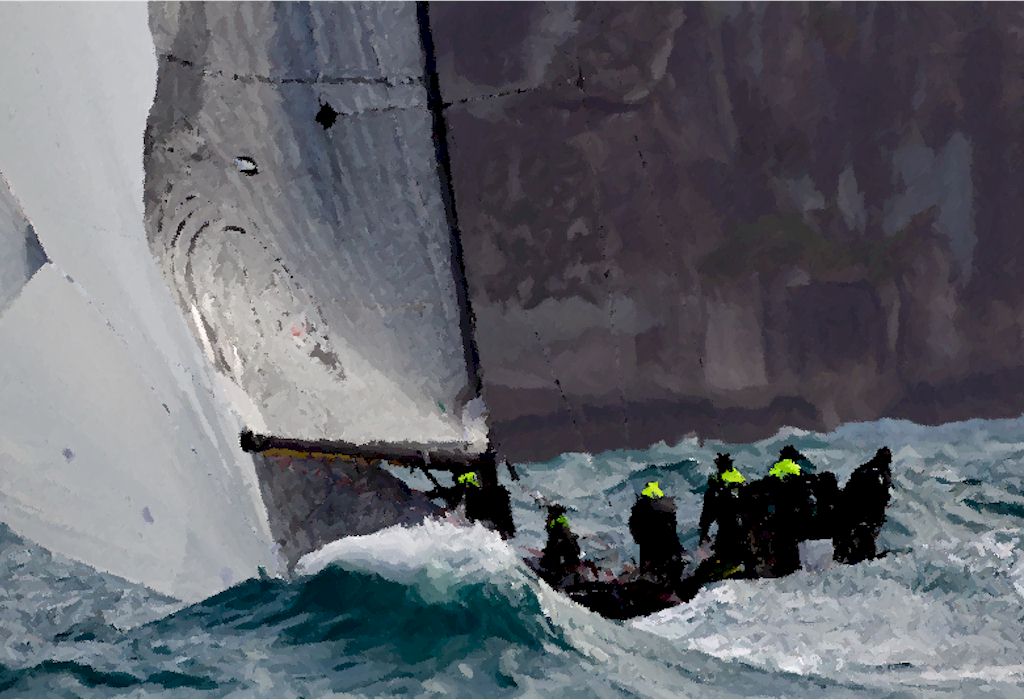
Polar curves are essential to yacht racing best practices. While racing, they help us solve performance, tactical, and strategic issues.
In this article, I will try to demystify what they are, what they represent, and where they come from.
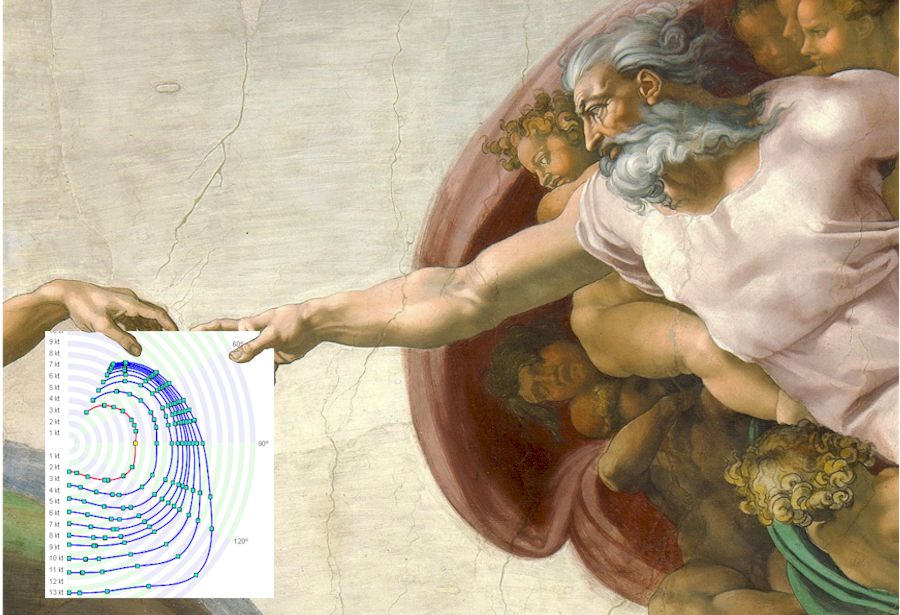
And, no. God doesn’t have anything to do with them. Or does he? …
What are they?
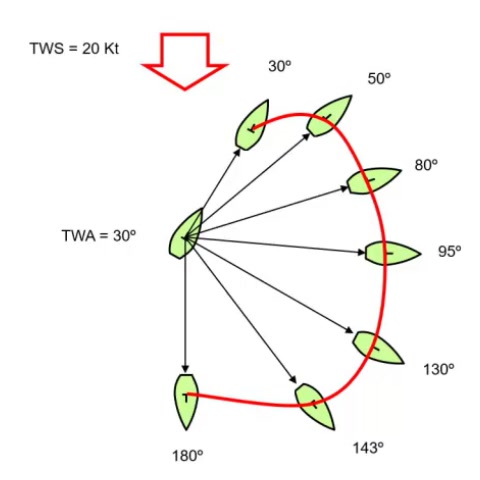
Well, let’s start by sailing! It is a perfect day. The wind is steady at 20 knots. This is our true wind speed (TWS). We decide to start by sailing at an angle of 30 degrees from where the wind is coming. This will be our true wind angle (TWA). After an hour, we realize we have sailed six nautical miles through the water. Interesting… We then decided to sail at a TWA of 50º. The distance done in an hour was 8.2 nm. The day is so nice that we repeat this routine for a few more TWAs.
Back home, we decide to plot the one-hour sail at each TWA. We choose a polar graph, as angles are shown radially from the center.
Finally, we join each consecutive end-point with a line. We sailed all distances in one hour; so, they are easily converted to boat speed in knots. Now we know how fast our boat sails through the water in every possible TWA.
Please, meet our polar curve for 20 kt of TWS!
Click the image to play...
Click the image to play...
What do they represent?
From the previous story, we get the answer. A polar curve represents the boat’s speed (BS), sailing at all possible angles to the wind (TWA) for a certain wind speed (TWS). In consequence:
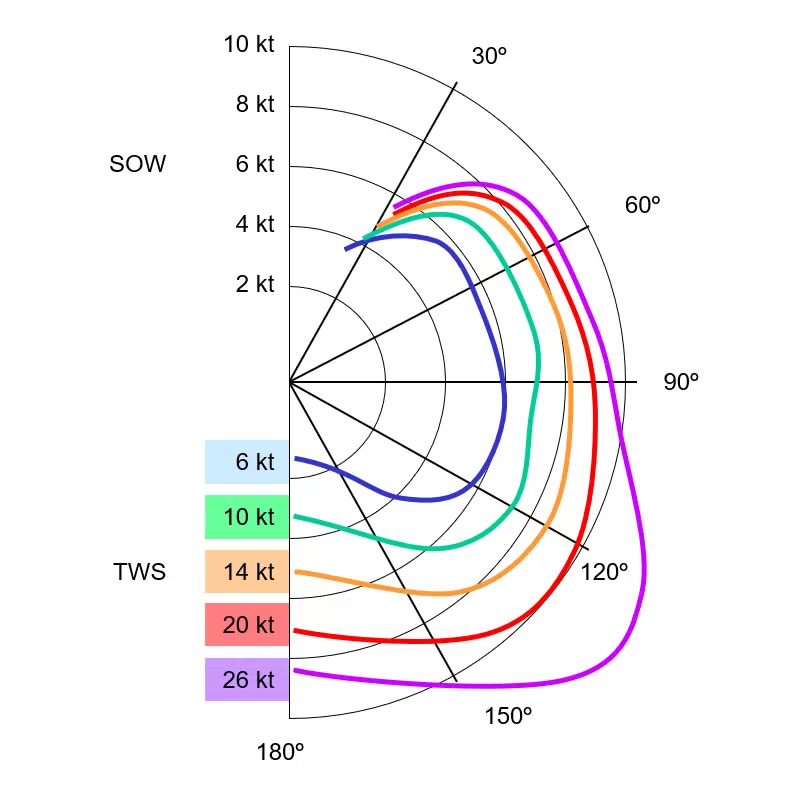
- Each polar curve corresponds to a single TWS. In our example: 20 kt.
- As there are infinite possible TWS, by convention, we only plot the curves for certain TWS (for example, 6, 10, 14, 20, and 26 kt). For other TWS, we’ll need to interpolate.
- For convenience, we use the “polar” graph type, where the angles represent TWAs and the concentric rings, the boat’s speeds.
The result is a rudimentary way of visualizing the performance of a sailing boat in every possible sailing condition.
Expressed mathematically, the BS is a function of TWS and TWA. Quite logical!
Where do I get my boat's polar curves?
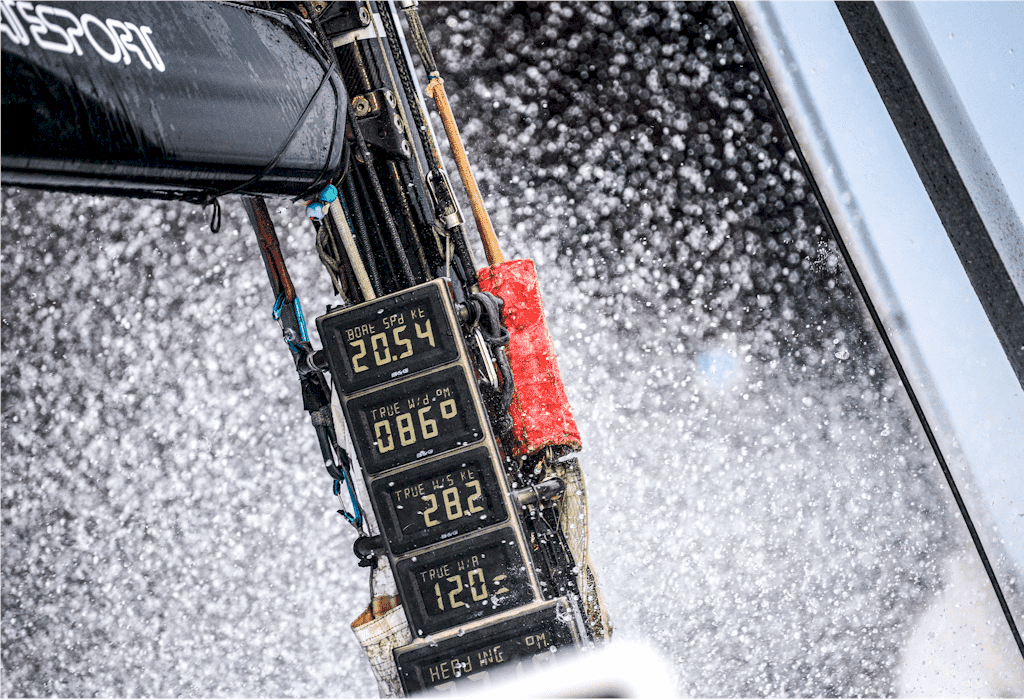
We are now aware that we can predict from the polar curves the boat speed by measuring the actual TWA and TWS. Then, by comparing the real and the expected boat speed, we’ll have a rough idea of how well we are sailing at that moment.
Great help if you are racing, but too much work. Checking the TWA and TWS and our polar curves graphic all the time is not a healthy option.
The solution is obvious! Load the performance information into a computer. Then connect it to the instruments to gather the wind data, and let the software do the job for you. Now, for example, you can check how off the target speed you are sailing at. And this is only the tip of the iceberg!
But here, we face an extra challenge; computers like numbers, not graphics. We will need high-quality numeric data to feed the software. Let’s see how to get them…
Collecting data while sailing.
This is the basic method described in our short story above. But not always is God on our side…
- It is a challenging job. You will need tons of data and analysis to get each point.
- It would take a lot of time. You will need to sail on many days to collect data for different TWS.
- It won’t be exact. Your instruments would need thorough calibration each time you go out sailing.
- Finally, the performance data you get will only reflect the ability of this crew to sail the boat rather than the boat’s full potential.
This is not a brilliant way to go if you start from scratch.
A velocity prediction program.
In the early ’70s, engineers at MIT were asked to develop a performance simulation software. They came back with a velocity prediction program, or VPP for short.
This system would yield the boat’s speed in any sailing condition with only the hull, sails, and rig characteristics as input. The results were terrific; the numbers were exact.
At some point, someone realized that if a VPP could predict any boat’s performance, why not use it as part of a rating system. And so, the ORC IMS rules were born.
So, if your boat was recently measured under the ORC system, check your certificate, and you will find the polar curve numbers.
If you are starting from scratch, this is the way to go!
So, what now?
Although both methods are pretty different, they are complementary. You can use the ORC certificate as a first approach. Then, with EVOLUTION running aboard, collect information to confirm or adjust the numbers.
The truth is that for some boats, there can be discrepancies between the VPP results and reality.
Consider this. As the ORC IMS rules are well understood, designers exploit its loopholes. They develop designs that trick the rules and beat the VPP (rating). For example, in the early 2000, code0 sails and square section boats had a slight advantage. Fortunately, the ORC improves the rules closing the loopholes every year.
Another typical case is wide transoms planing boats. Depending on the swell of any particular day, surfing can start at different TWA/TWS. For these days, you might need an adjusted set of polar curves.
Some technical tidbits…
- Polar curves have only the water surface and the wind trajectory as their frame of reference. Boat speeds are ALWAYS through the water.
- They are symmetric to the wind. The port and starboard sides have the same values. So, we can graph or input one side only.
- Geographic coordinates, direction, and ground speed (SOG) have no meaning. This is the realm of performance through the water.
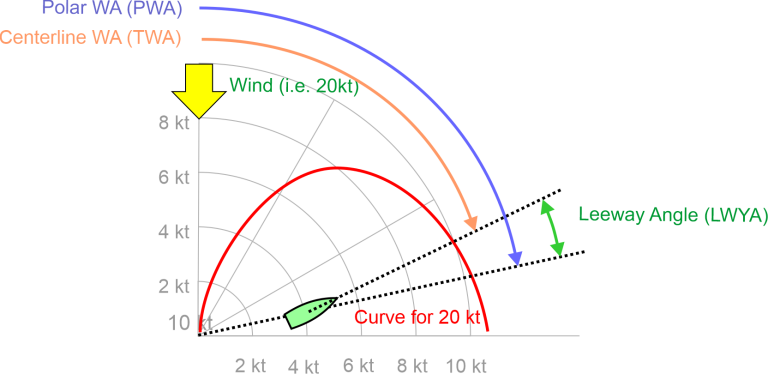
When polar curves are created by VPP programs, all TWA are measured from the wind to the boat’s course, NOT to its centerline, as these angles include the leeway. I prefer to call them polar wind angles (PWA). We should be careful when comparing them to the instrument’s TWA, as it is like comparing apples and oranges!
When exporting the TWA targets to the displays, EVOLUTION subtracts the leeway from the polar wind angles, so you are comparing apples with apples.
A final word of advice!
If the boat’s performance numbers don’t match the data coming from your instruments, there are many possible reasons. The last of which is incorrect polar curves.
Your instruments might need calibration. Correct TWA and TWS are essential to get an accurately predicted boat speed. Actual boat speed also needs to be correctly measured. Sometimes wind speed at the mast top differs from the effective wind on the sails below.
Collecting and analyzing several races/trials is best before messing with the boat’s polar curves. Seeking advice from experts is always a good idea.